| Federal Finance Charts: | Expenses/Receipts/Debt as % of GDP | Public Debt, Real Dollars | Funding of Federal Operations | Discretionary Spending |
|---|
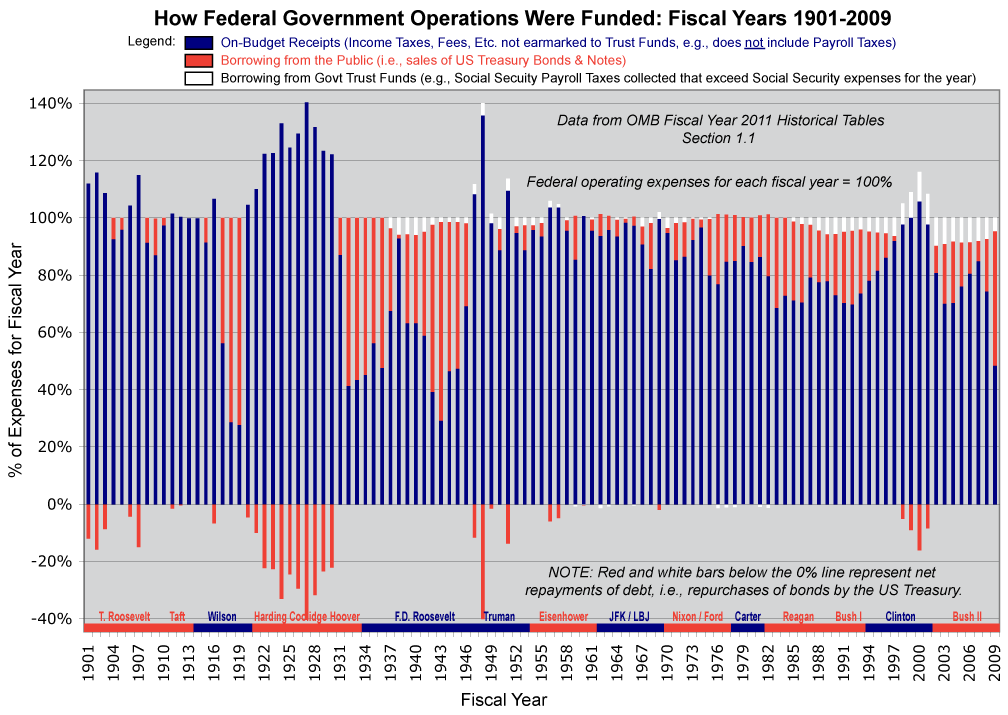
Notice that repayments of debt (bars below the 0% line) can only occur when other federal funding exceeds operating expenses (bars extend above the 100% line).
The heavy debt incurred from 1917-19 to finance WWI was significantly repaid during the 1920s when federal tax collections exceeded expenses for several years. Not so for the debt incurred from 1940-46 to finance WWII.
Also, with regard to the white bars: Federal law requires any surplus collections of earmarked taxes such as Social Security payroll taxes to be accounted as balances in Federal Trust Funds. Those funds are actually on deposit with the US Treasury, in exchange for which the US Treasury issues non-marketable securities -- in other words, interest bearing IOUs -- which obligate the US Treasury to return those funds as needed to pay the expenses for which the taxes were earmarked, e.g., Social Secutiry benefits. In the meantime, the US Treasury is free to use those funds to pay other government expenses, and the borrowed funds are accounted on-budget as “Debt held by Federal Government Accounts” (as contrasted to “Debt held by the Public”). Gross Federal Debt (colloquially known as the “National Debt”) is the sum of the two -- debt held by the public and debt held by federal government accounts. But, typically, the borrowing reported by the goverment each year as the net Federal deficit includes only the amounts borrowed from the public.
In the early years of Social Security, during WWII, few benefits were paid although payroll tax collections had begun, and those taxes helped to pay some of the expenses of the war. Note that this borrowing was repaid (white bars below the zero line; you can see them better on the PDF version of the graph) during a few years from 1958 to 1982 during which Social Security benefits exceeded collected payroll taxes. In 1983, on recommendation of the “Greenspan Commission” based on its assessment of the Social Security system, a series of programmed increases in the payroll tax rate was passed by Congress with the final rate increase occuring in 1990. At that time, much more significant balances began accumulating in the Social Security trust funds, all of which were required by law to be borrowed by the US Treasury, as seen by the white bars at the top. None of these borrowed amounts have been repaid, even in the tax-surplus years of the Clinton administration; indeed, by law, they cannot be repaid until they are needed by the trust funds to pay benefits, i.e., in any year when benefits and expenses happen to exceed payroll-tax revenues. This is expected to occur sometime before the year 2020 if there are no further increases in payroll tax rates. Because of the large balances that have accumulated in the Social Security trust funds, currently about $2.5 trillion, repayments will impose a significant additional burden on Federal finances. In that respect, evey white bar at the top of the funding for a fiscal year may be regarded as an expense accrued but deferred for payment until a future time.
It is also of interest that extensive Federal borrowing from the public has typically occured during times of war (1917-19, 1940-45, 1965-75, and the early 2000s) and in hard economic times (the Great Depression of the 1930s). The significant increases in peacetime borrowing that occured during the 1980s and early 1990s were unprecedented in US history.